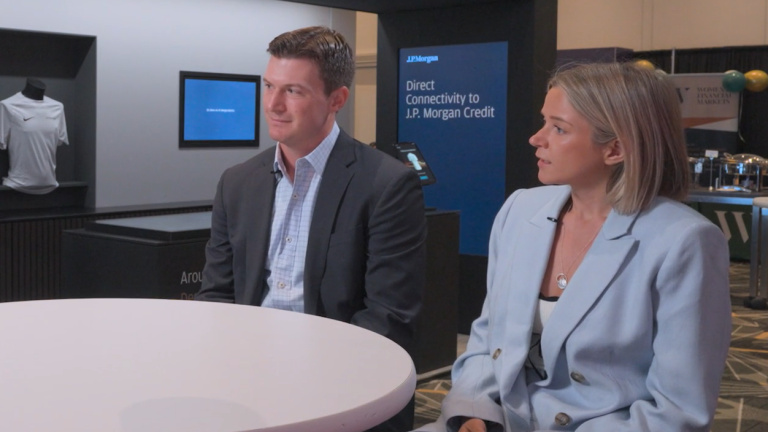

April was a major month for volatility and stressed market conditions. A time when “maximizing for liquidity” was paramount, says JP Morgan’s Brian LaRocca, driving increased use and demand for real-time data and optimized portfolio-building tools.
The head of Vida portfolio solutions of Americas shares his views on where the sell-side firm saw an uptick in usage and patterns of use in building fixed income baskets, highlighting the focus on liquidity, ratings, duration, and receiving fast indicative pricing.
Looking at platform engagement, LaRocca discusses where the recent turbulent market conditions has led to growth in JP Morgan’s Vida platform across its internal and external user base, and he also unpacks how the plans to develop out the cross-asset solution’s functionality further.
Transcript
Jo Gallagher How did April’s market volatility challenge execution strategies?
Brian LaRocca Well, to take a step back, Vida is a suite of cross-asset portfolio products using the entire investment lifecycle. That’s from pre-trade to post-trade. We’re in five distinct businesses, and there are four key pillars underpinning each one of them–Create, Analyze, Manage, and Report. Now, with respect to volatility that we saw in April. I think it’s best exemplified by usage in our BetaOne product. BetaOne is our tech solution for portfolio trading in the fixed-income space. We wanted to give clients a walled garden where they could come in and anonymously upload a portfolio and get indicative pricing and analytics on that portfolio. But there’s another funnel in which clients can actually build a basket. Now, what we heard in April, backed up by a lot of real data, was that clients were coming in to build their own basket and send that into our pricing engines. The way that the basket builder works is clients would come in for a predefined universe, say USIG. Then they would set a goal. So something that was paramount during this time was maximizing for liquidity. Then they would filter that universe by a bunch of different characteristics, say they could filter out any sort of low-rated bonds or make sure they’re on the short end of the curve. And then they can stream that portfolio by being underweight and overweight different industries or tickers, specifically ones most likely to have some sort of tariff risk. They run that through the pricing engine, and we’re able to give them indicative pricing right there.
Jo Gallagher So on the real-time data aspect of it, how is real-time data playing a bigger role in being able to profile corporate risk and also navigate turbulent conditions like we’re seeing?
Brian LaRocca Well, what is essential is to have everything at your fingertips. So clients can either upload their portfolio or build a basket and within 30 seconds, would have indicative pricing that is extremely close to firm pricing. At the same time, the amount of data that we provide is astounding. Specifically, we backtest the portfolio over the past year. We’re comparing their portfolio to ETFs that trade in the market, and we’re visualizing the different composition between ETFs and their actual portfolio. We provide liquidity scaling, which is their own proprietary algorithm we use to see how liquid a portfolio is, as well as engineering the JP Morgan fit. So how well the client’s request fits in with JP Morgan’s own internal inventory. We’re completely transparent where we’re a good match and where we are not.
Jo Gallagher Who is the user base for JP Morgan’s Vida platform, and how have you seen engagement and patterns of use change during this volatility?
Brian LaRocca Vida’s core users are asset managers, insurance companies, hedge funds, and pension funds. And what’s interesting is, since Vida is five different verticals, we see these users use them across the entire spectrum. We have 1,300 monthly active users externally and 600 internally. Monthly active users is a good metric, but we would like to see intensity. We’d like to time spent on the platform and a rich user experience. This is exactly what we saw in April. We knew about it anecdotally from clients saying they were using the tool, but actually we saw a huge amount of depth and price portfolios in this very volatile time. One thing about the internal usage, what’s great about it being so high is that we’ve invested a lot in data portability so that there’s cross-collaboration between internal users and external users. That way our sales force can speak a common language with their clients to look at a portfolio, price it, and execute it.
Jo Gallagher And how do you plan to build out the platform further and increase its engagement rate?
Brian LaRocca The next feature that’s going to be rolled out shortly is going to be our replicate features. Its an extension of optimization, which clients can pick an ETF and kind of get the same sort of style, the composition of that ETF and build a portfolio with those constituents. Next up after that is going to be our market monitor, which we think is going to be a home base for usage in the platform. People are going to see streaming prices. They’re going to see different baskets, generic baskets, say, you know, three-year IG. But they’re also going to have access to our own thematic baskets. So say we wanted to create a tariff basket a client can easily put on, or at least as a starting point, click on it, re-optimize it, and then send it to our desk. This is all going to be overlaid with JP Morgan’s award-winning research and content. That will be on the left side of the portal, in which you can easily click and put that trade into action.
Jo Gallagher I’d like to thank Brian for his insight, and of course, you for watching. To catch your other shows, including Trader TV This Week every Monday at 6.45 am UK time, go to Tradertv.net.
Catch Trader TV shows each week:
To watch Trader TV This Week shows go to – Video
Or make sure to follow us on LinkedIn – Trader TV’s LinkedIn
Available as a podcast – here